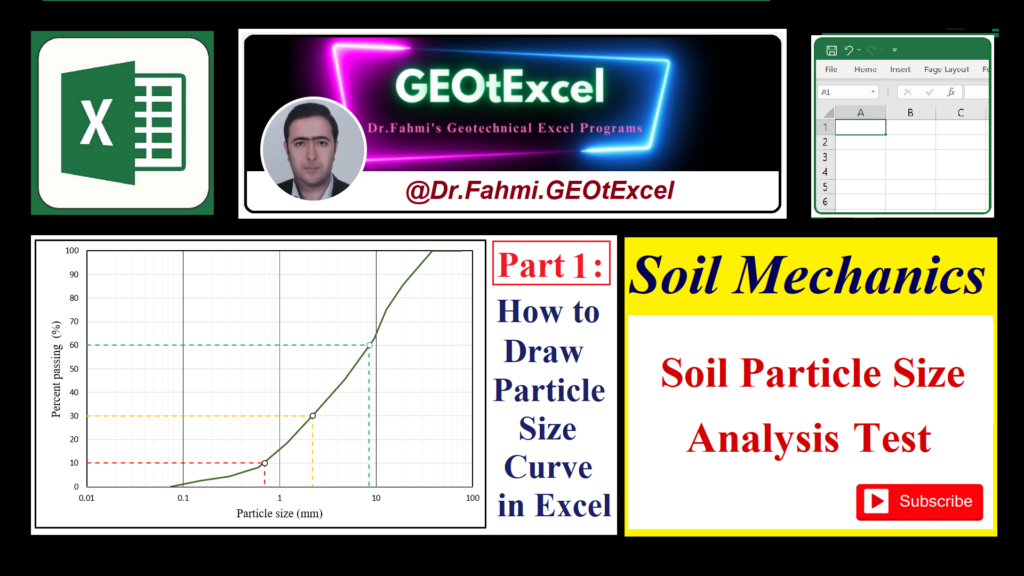
Excel Spreadsheet: #soilmechanics #Particle_size #Gradation_curve :
A semi-logarithmic particle size graph is a valuable tool in soil mechanics, allowing engineers and geologists to visualize and analyze the distribution of soil particle sizes. By presenting particle size data on a logarithmic scale for one axis, it effectively compresses a wide range of particle sizes into a manageable space while maintaining a linear scale on the other axis. This graphical representation is instrumental in understanding soil properties, such as permeability, compaction, and drainage characteristics, aiding in the design and analysis of various geotechnical engineering projects.
Accurate and excellent.
Thank you.