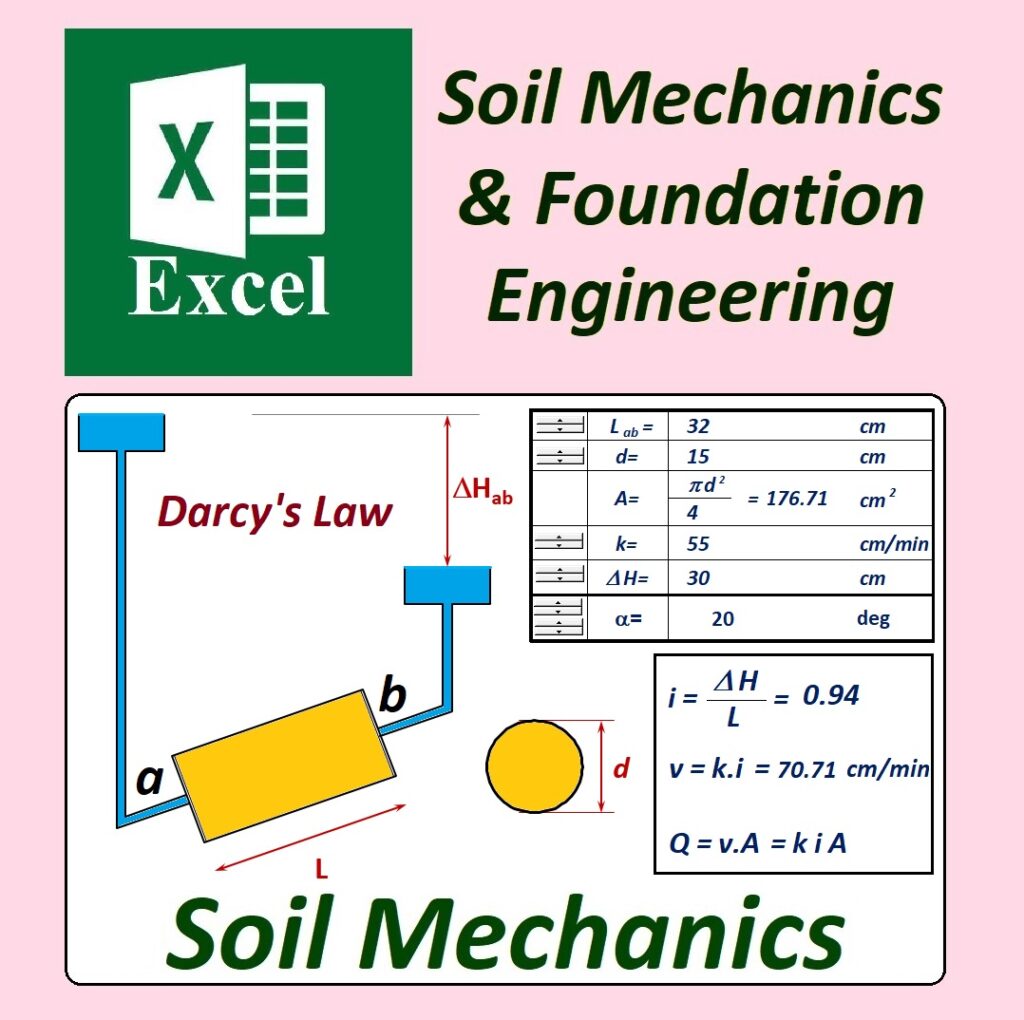
How can we calculate the flow rate through soil using Darcy’s law?

βœ… GEOtExcel: Soil Mechanics & Foundation Engineering Excel Spreadsheets:
β˜‘ Soil mechanics: Darcy’s law (alpha version):
βœ… YouTube channel Address:
β–Ά https://www.youtube.com/@Dr.Fahmi.GEOtExcel
Hydraulic gradient, velocity and flow rate calculation:
πŸ“Š Geotechnical Excel Spreadsheets
Designed by Dr. Ahmad Fahmi

soilmechanics #soil_mechanics #Darcy_law #foundation_engineering #excel_Spreadsheet #excel #Hydraulic_gradient #flow_rate

The Link on the YouTube Channel:
https://youtu.be/YqRafl_g9Wo

What is the concept of the equipotential lines in seepage?

What is the concept of the equipotential lines in seepage?

What do equipotential lines represent in flow net?

βœ… GEOtExcel: Soil Mechanics & Foundation Engineering Excel Spreadsheets:
βœ… Soil mechanics: Seepage:Flow Nets:
βœ… Equipotential lines: Concept
β–Ά More Videos on Our YouTube Channel:
β–Ά https://www.youtube.com/@Dr.Fahmi.GEOtExcel
πŸ“Š Geotechnical Excel Spreadsheets
Designed by Dr. Ahmad Fahmi

#soilmechanics #soil_mechanics #seepage #foundation_engineering #excel_Spreadsheet #excel #equipotential #flow_net

The Link on the YouTube Channel:
https://youtu.be/YkrkLgN6AR4

Hydraulic Gradient & Darcy’s Law: An Innovative Excel Spreadsheet

How can we calculate the hydraulic gradient between two points in the soil? How can we calculate the flow rate through soil using Darcy’s law?

βœ… GEOtExcel: Soil Mechanics & Foundation Engineering Excel Spreadsheets:
βœ… Soil mechanics: Hydraulic gradient:
βœ…Darcy’s Law: Hydraulic gradient, velocity and flow rate calculation
β–Ά More Videos on Our YouTube Channel:
lβ–Ά https://www.youtube.com/@Dr.Fahmi.GEOtExcel
πŸ“Š Geotechnical Excel Spreadsheets
Designed by Dr. Ahmad Fahmi

The Link on the YouTube Channel:
https://youtu.be/NhJcIhNqUrs

Excel Spreadsheet for Rock Quality Designation Calculation

Excel Spreadsheet: #geotechnical_engineering #rock_quality #excel_spreadsheet :

βœ… GEOtExcel: Soil Mechanics,Foundation Engineering & Engineering Geology Excel Spreadsheets:
βœ… Geotechnical Engineering: Engineering Geology: RQD Calculation (Rock Quality Designation)
βœ… Concept-oriented Excel Spreadsheet: RQD Concept (Random core samples, Random Examples)

β–Ά More Videos on Our YouTube Channel:
β–Ά https://www.youtube.com/@Dr.Fahmi.GEOtExcel
πŸ“Š Geotechnical Excel Spreadsheets
Designed by Dr. Ahmad Fahmi

Rock Quality Designation (RQD) measures the quality of rock cores from boreholes by calculating the percentage of core pieces longer than 10 cm. It helps assess rock mass integrity, with higher RQD values indicating better quality rock with fewer fractures, and lower values indicating more fractured, poorer quality rock.
The Link on the YouTube Channel:

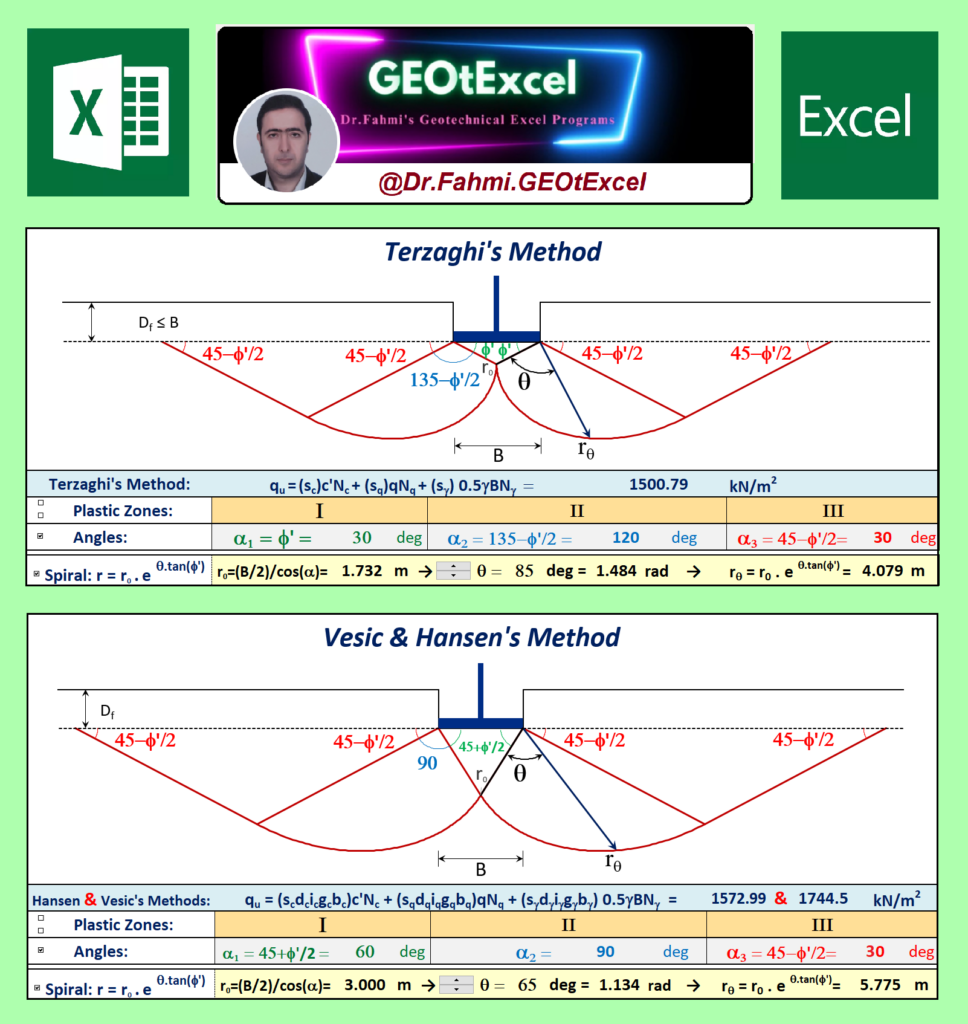
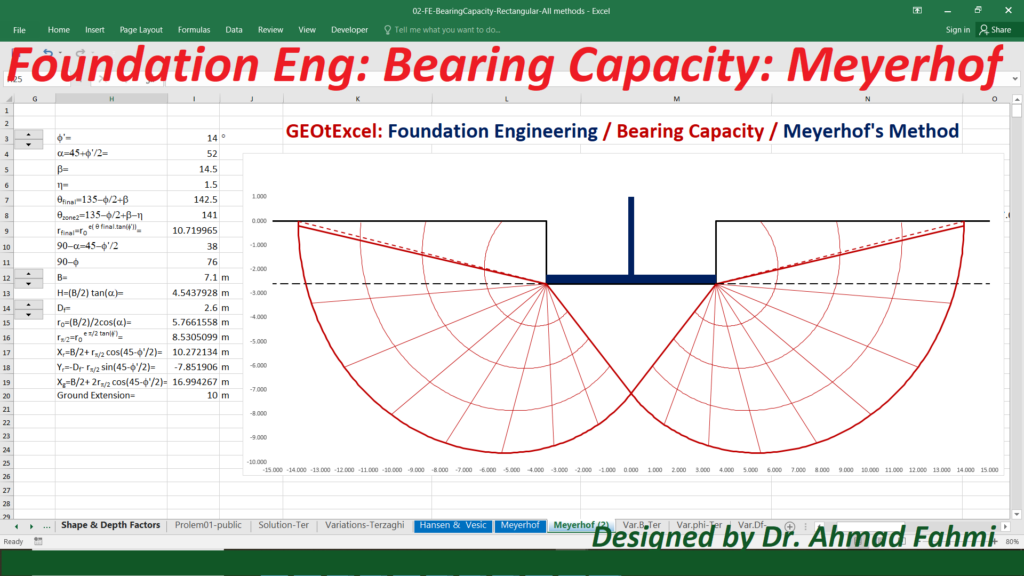
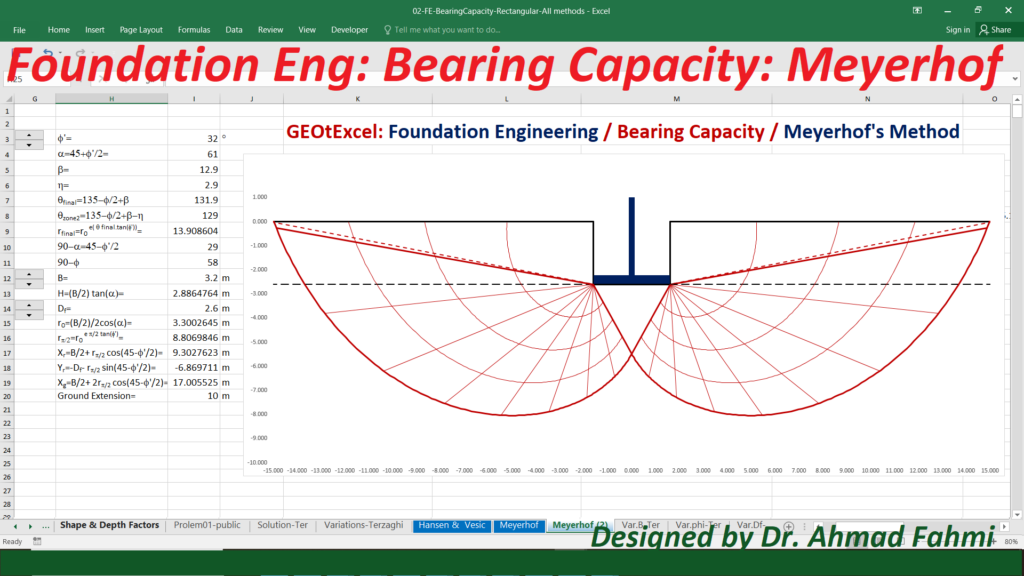
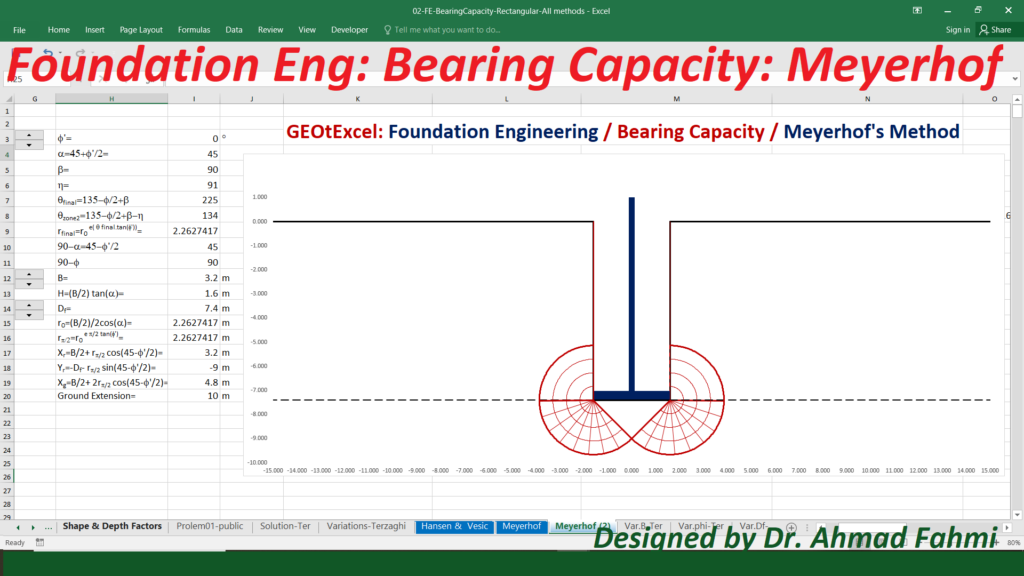
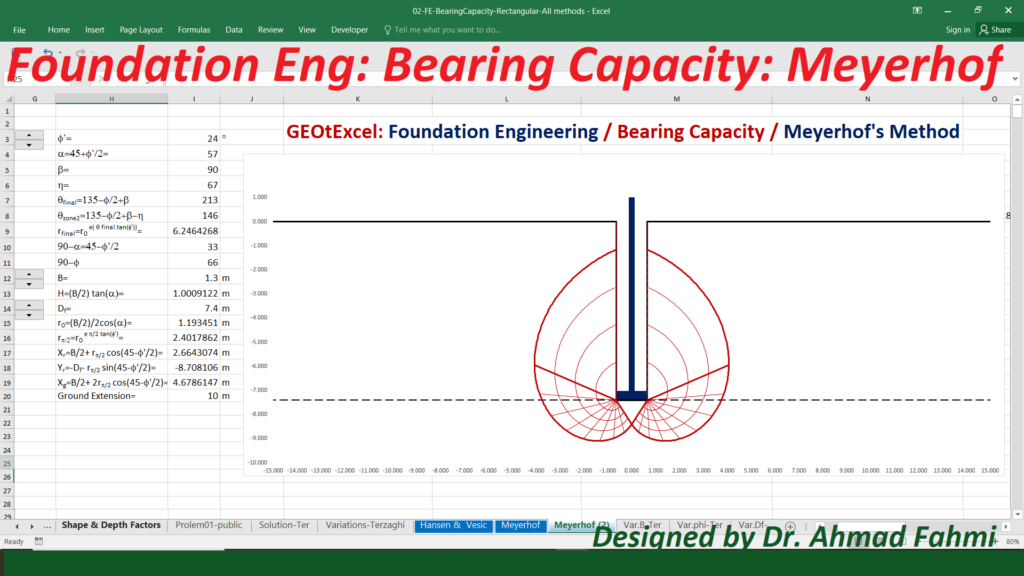
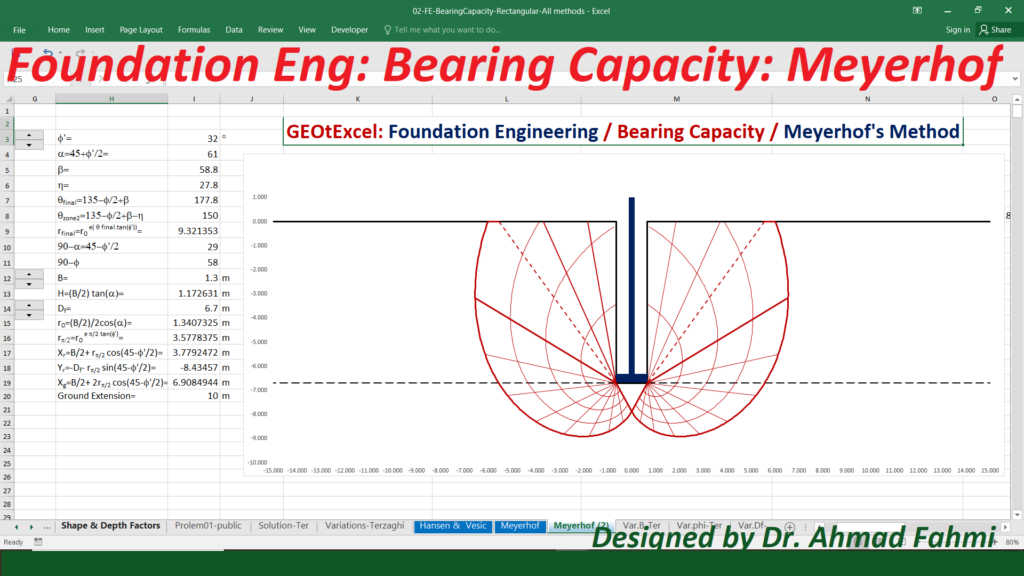
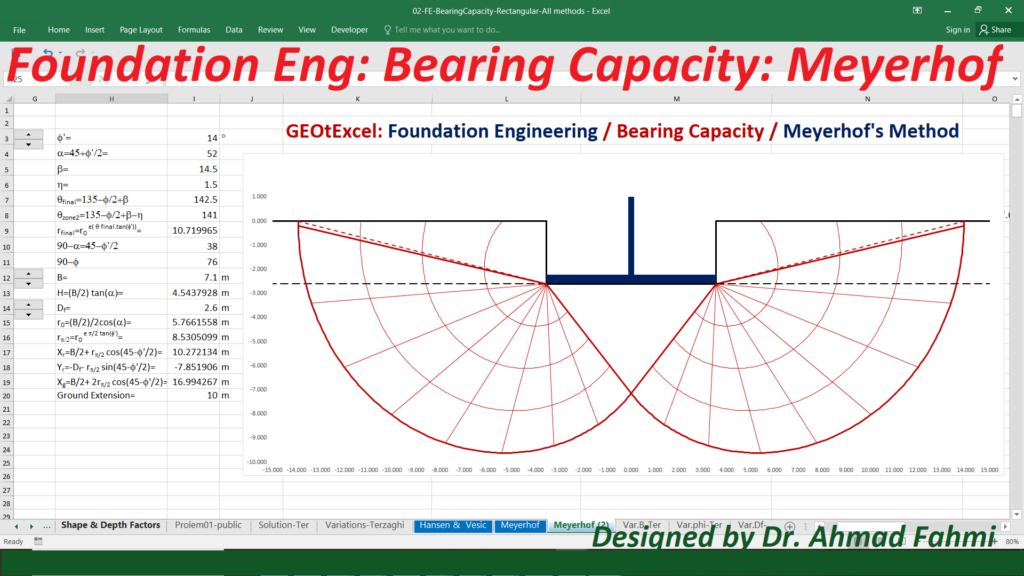
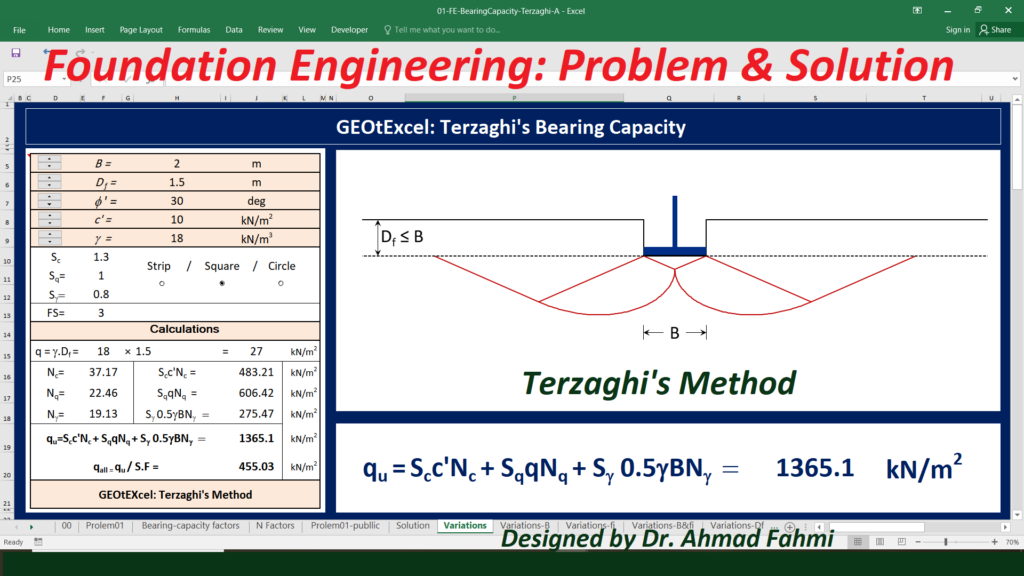
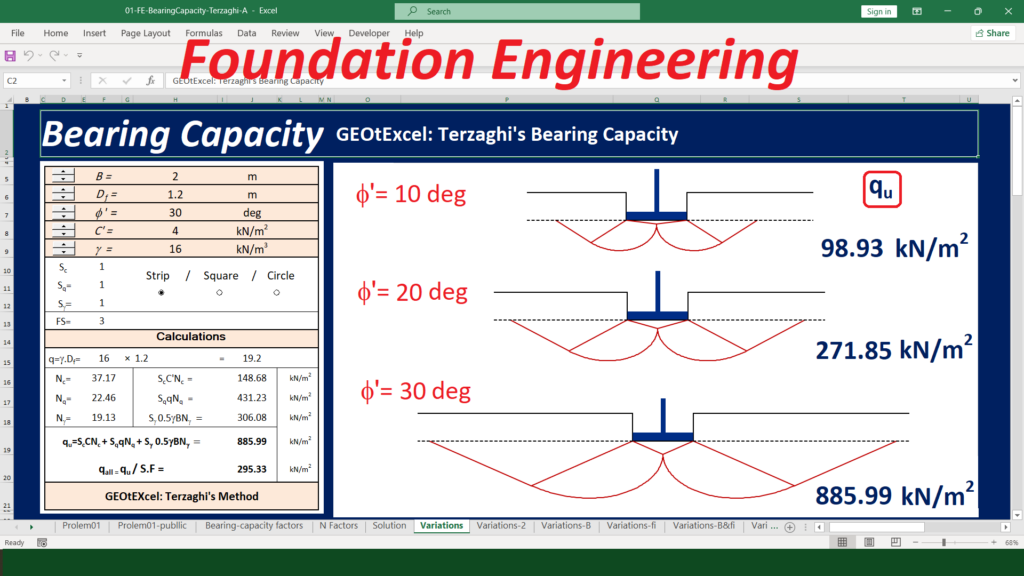
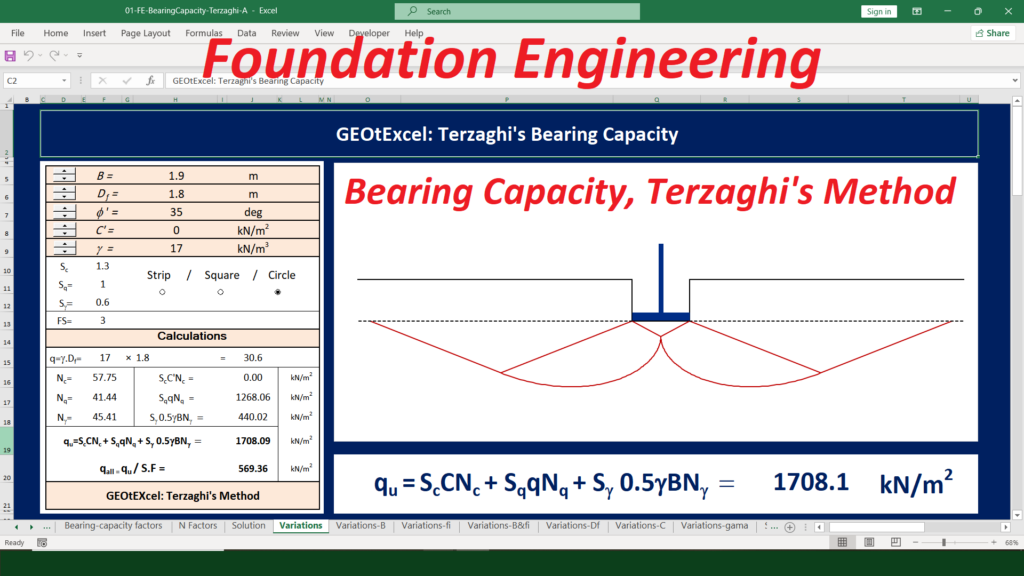
How does changing the internal friction angle of the soil affect the bearing capacity? (Excel Spreadsheet)

Excel Spreadsheet: #foundation_engineering #bearing_capacity #excel_spreadsheet :

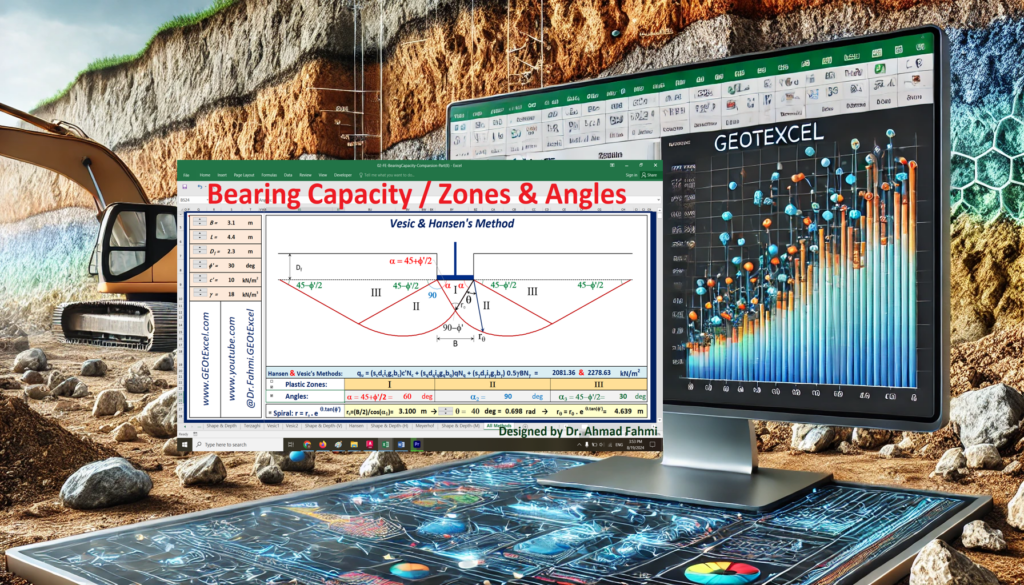
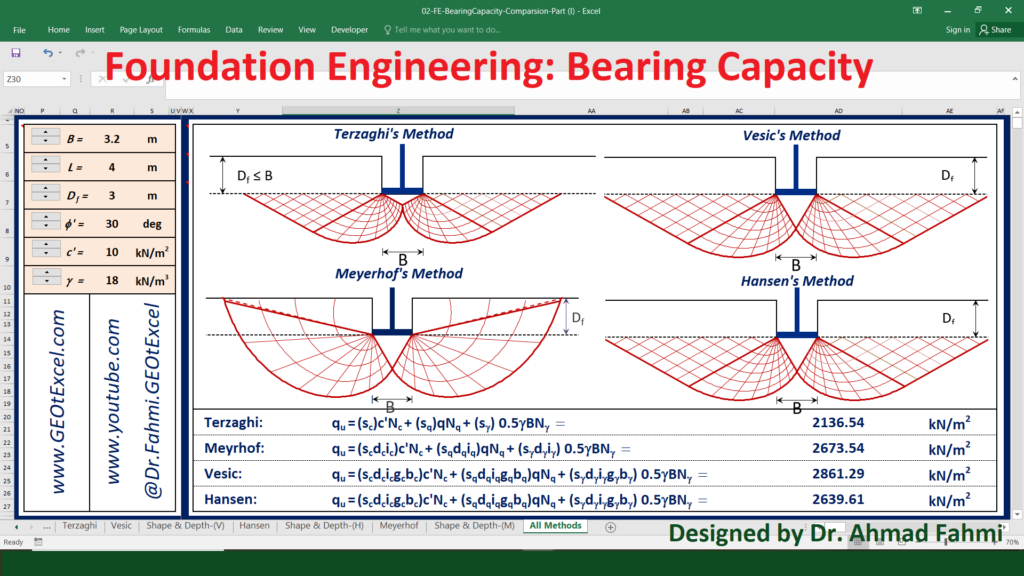
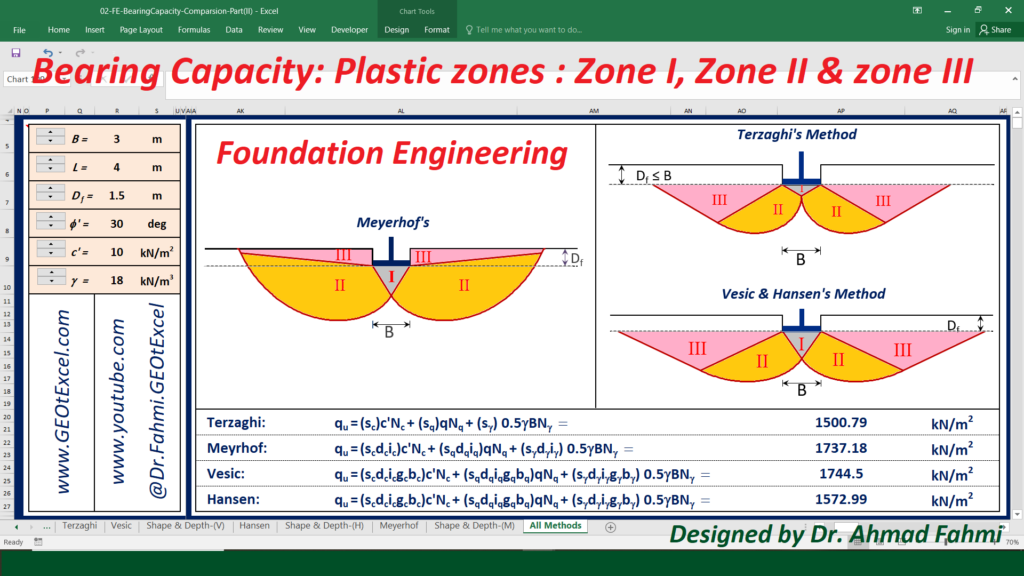
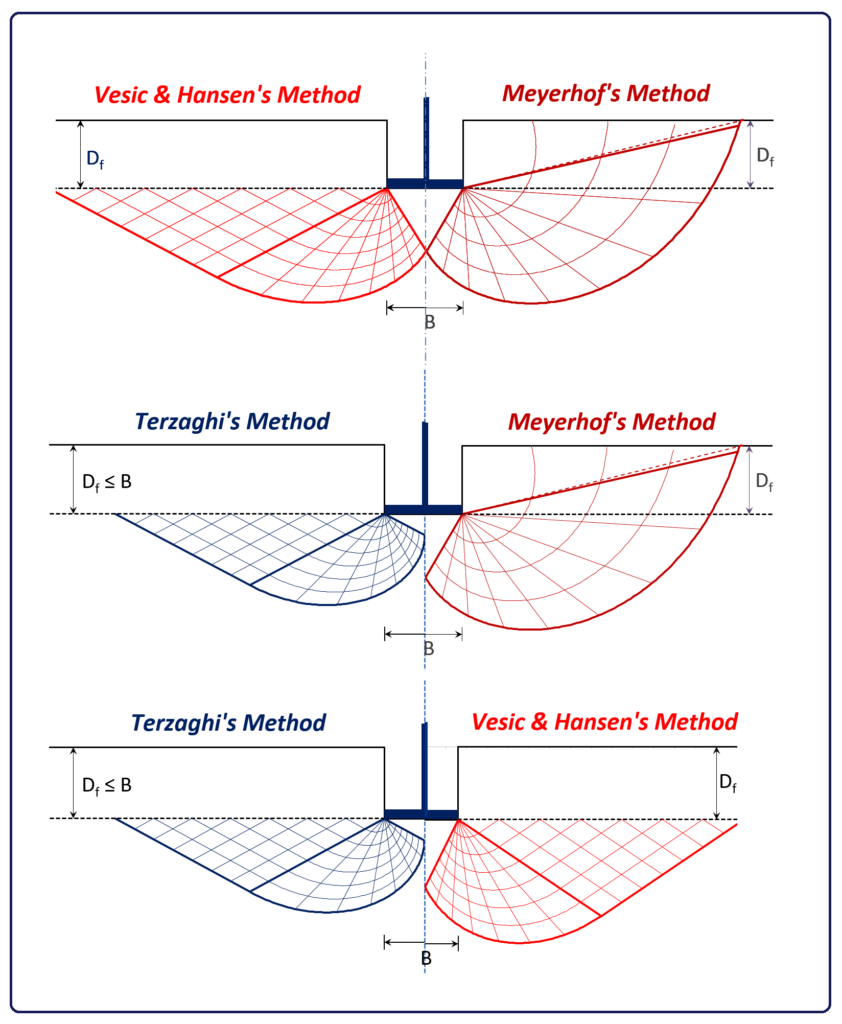
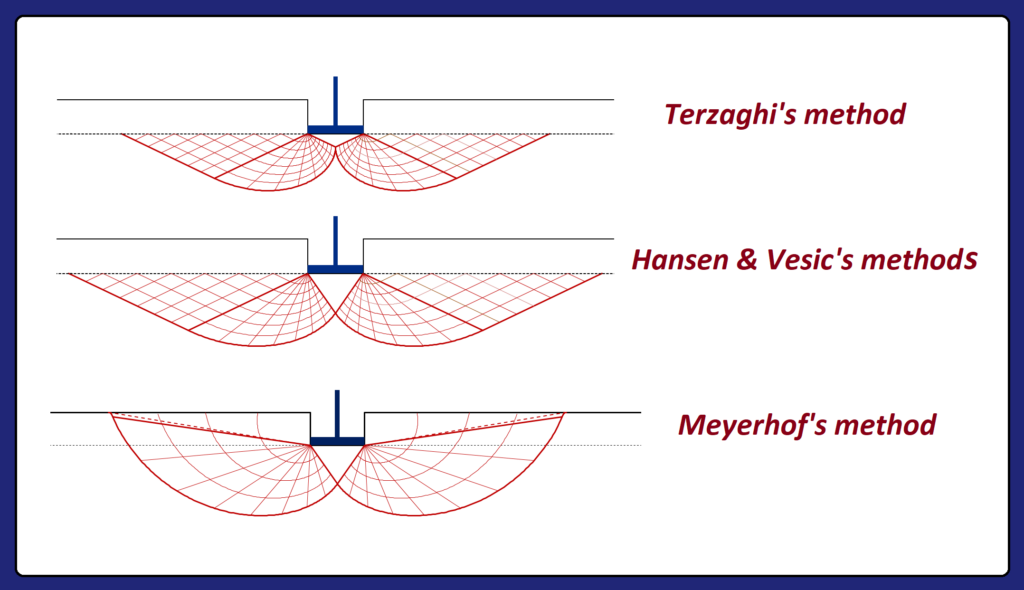
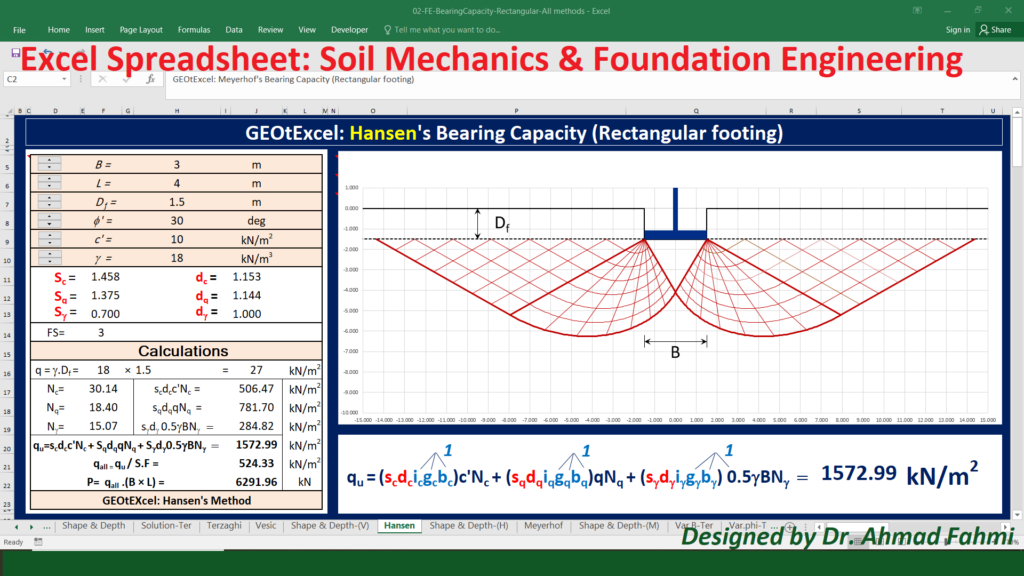
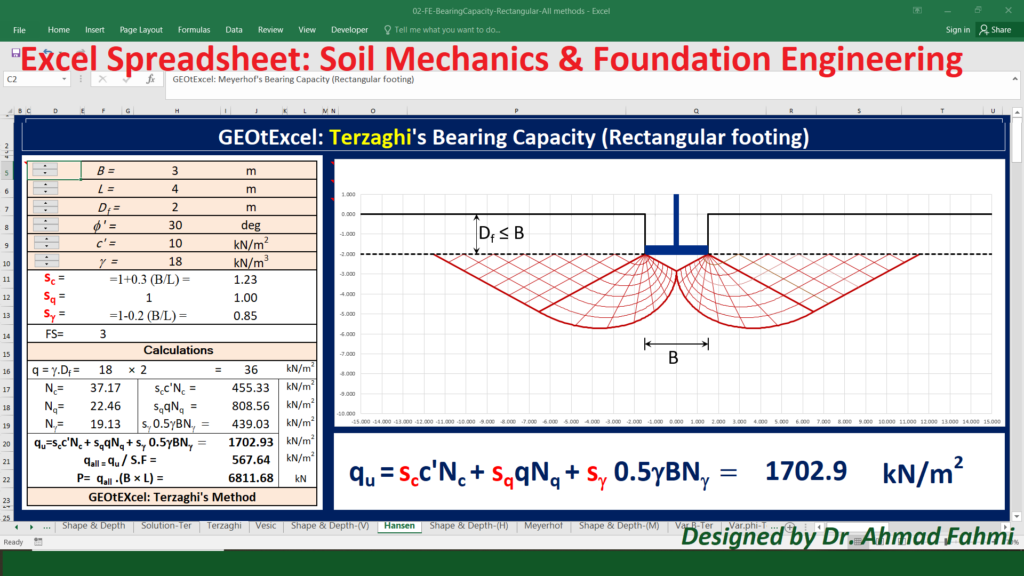
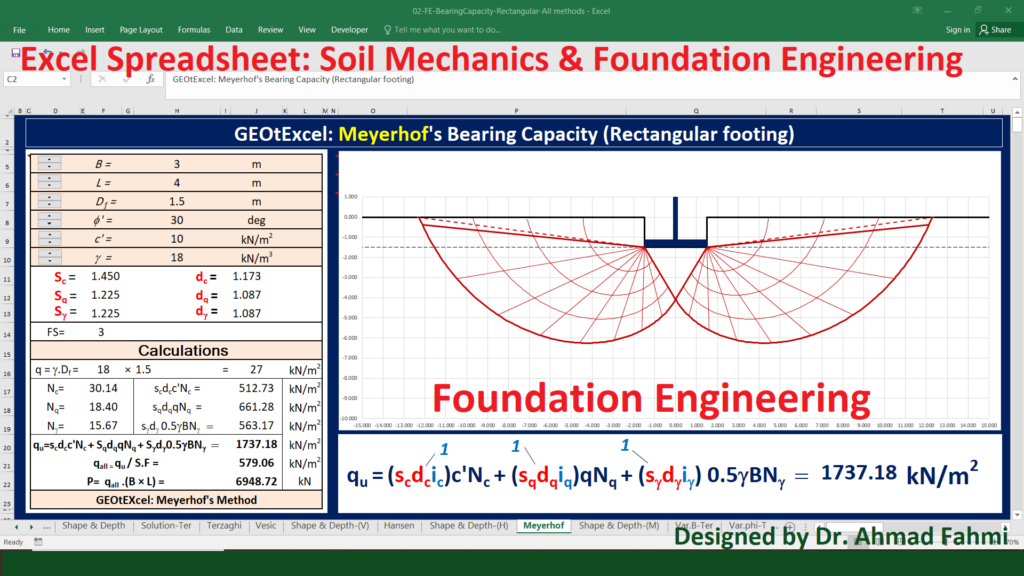
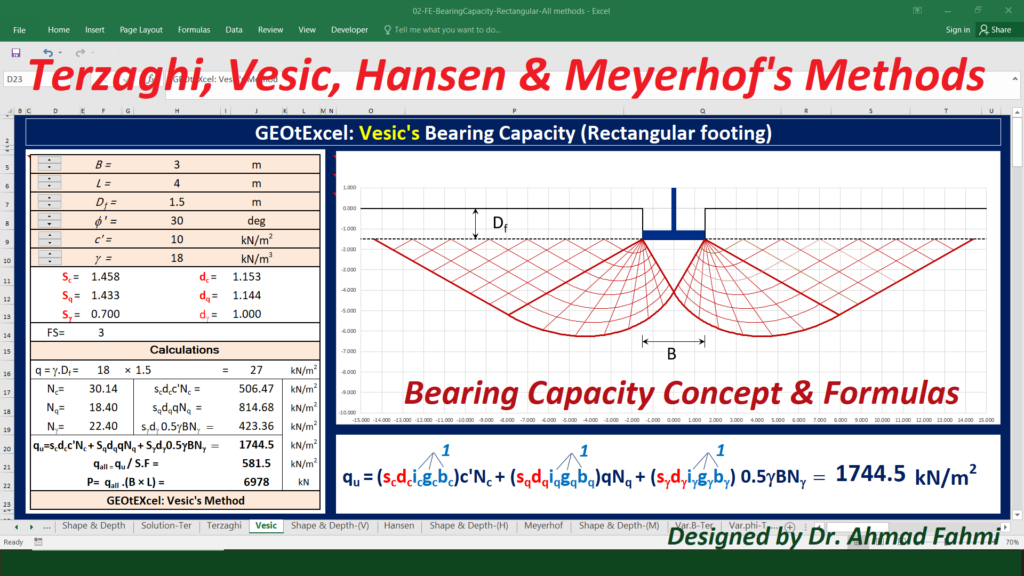
The failure zone under a foundation can be divided into three key parts:
1- Triangular Zone: This zone, directly beneath the foundation, fails in a triangular pattern due to compression. Higher friction angles result in a larger triangular zone, as the soil can better withstand compression without failure.
2- Radial (Logarithmic Spiral) Shear Zone: This zone represents the path of soil failure around the foundation in a spiral pattern. With higher friction angles, the radial shear zone tends to be larger, as the soil can resist shear stresses more effectively.
3- Triangular Rankine Passive Zone: Located outside the failure surface, this zone is under passive stress and contributes to the bearing capacity. Higher friction angles lead to a larger Rankine passive zone, providing more support to the foundation.
πŸ’Ž In summary, higher friction angles result in larger triple zones, including the triangular, radial shear, and Rankine passive zones. This enlargement collectively contributes to a higher bearing capacity for the foundation.

The Link on the YouTube Channel:

Soil Mechanics/Unified Soil Classification System (USCS)/Excel Spreadsheet

Excel Spreadsheet: #soilmechanics #Soil Classification #USCS :

The Unified Soil Classification System (USCS) is a widely-used method for categorizing soils based on their engineering properties. It classifies soils into two main groups: coarse-grained soils, such as gravels and sands, and fine-grained soils, including silts and clays. Within these groups, soils are further classified based on their grain size distribution, plasticity, and compressibility characteristics. This system utilizes a combination of letters and symbols to represent various soil types, such as GW for well-graded gravels, SM for silty sands, and CL for low-plasticity clays. The USCS provides engineers and geologists with a standardized framework for understanding and analyzing soil behavior in construction and geotechnical applications.

The Link on the YouTube Channel:

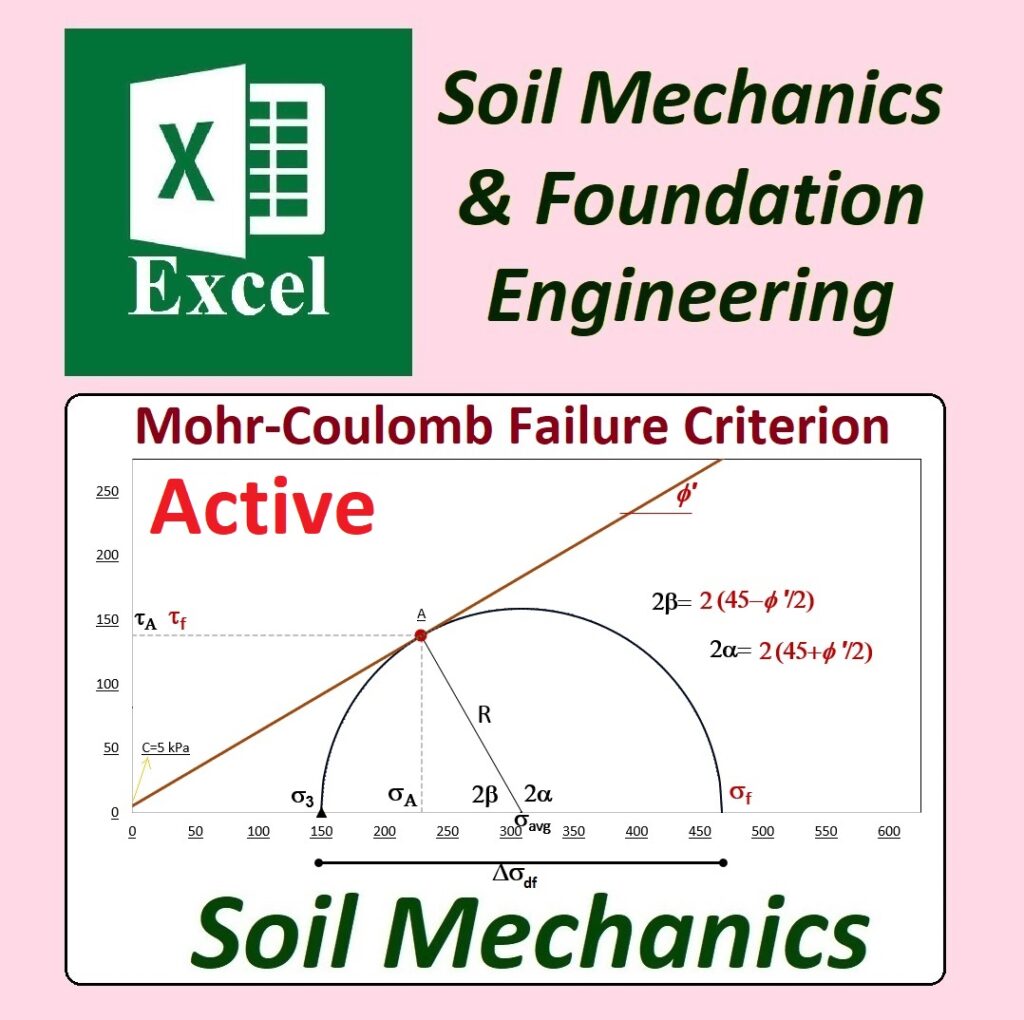
Soil Mechanics: Shear Strength: Triaxial CD & CU Tests (Excel Spreadsheets)

Excel Spreadsheet: #soilmechanics #Shear Strength #Triaxial CD & CU Tests :

The triaxial shear tests, including the consolidated drained (CD) and consolidated undrained (CU) tests, are essential in geotechnical engineering. They provide valuable data on soil behavior under different loading conditions. The CD test assesses shear strength parameters like cohesion and angle of internal friction, while the CU test helps evaluate undrained shear strength, particularly important for saturated soils. Results from these tests inform foundation design, slope stability analysis, and other geotechnical considerations in construction projects.The triaxial shear tests, including the consolidated drained (CD) and consolidated undrained (CU) tests, are essential in geotechnical engineering. They provide valuable data on soil behavior under different loading conditions. The CD test assesses shear strength parameters like cohesion and angle of internal friction, while the CU test helps evaluate undrained shear strength, particularly important for saturated soils. Results from these tests inform foundation design, slope stability analysis, and other geotechnical considerations in construction projects.

The Link on the YouTube Channel:

https://www.youtube.com/watch?v=ABzuZtPJ1-o

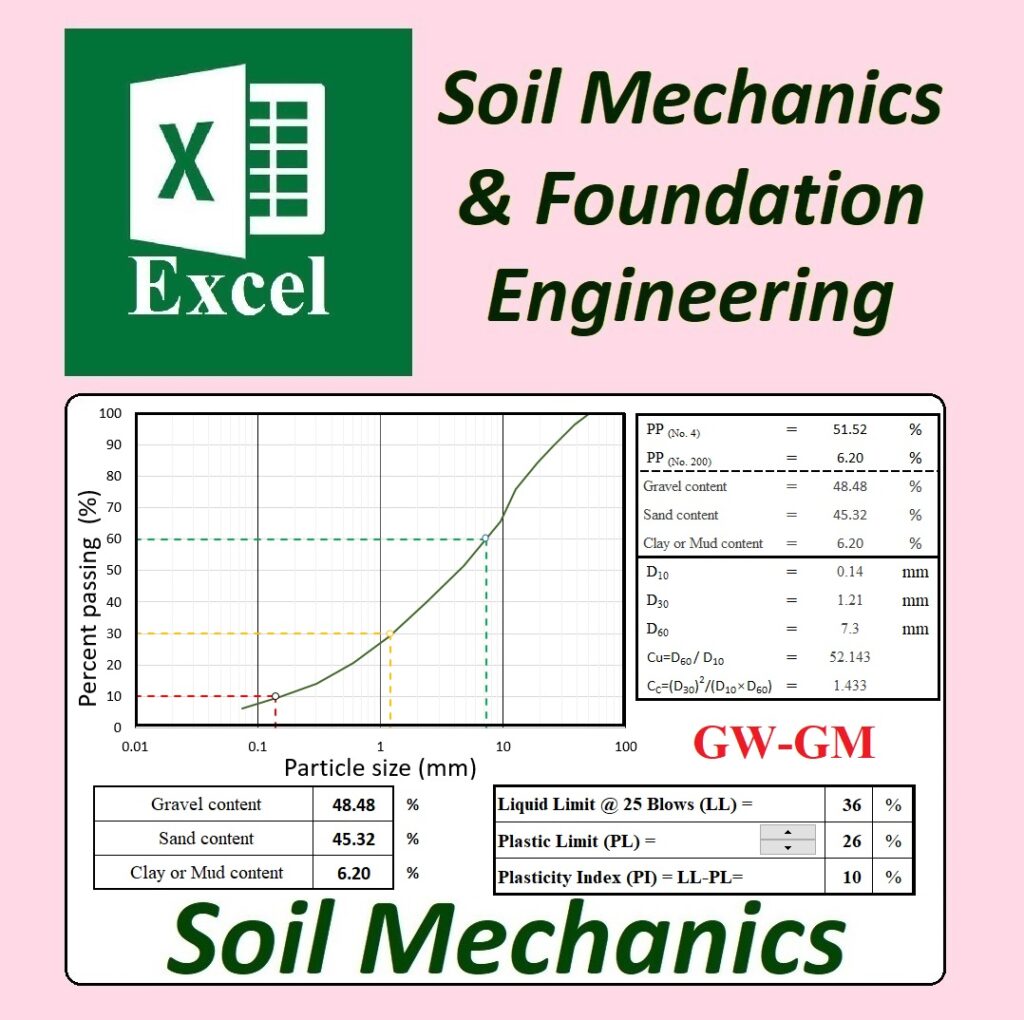
Soil Mechanics: How can soil particle size be graphically represented in Microsoft Excel?

Excel Spreadsheet: #soilmechanics #Particle_size #Gradation_curve :

A semi-logarithmic particle size graph is a valuable tool in soil mechanics, allowing engineers and geologists to visualize and analyze the distribution of soil particle sizes. By presenting particle size data on a logarithmic scale for one axis, it effectively compresses a wide range of particle sizes into a manageable space while maintaining a linear scale on the other axis. This graphical representation is instrumental in understanding soil properties, such as permeability, compaction, and drainage characteristics, aiding in the design and analysis of various geotechnical engineering projects.

Soil Mechanics

The Link on the YouTube Channel:

Soil Mechanics: Soil Classification (USCS)

Excel Spreadsheet: #soilmechanics #USCS #unified #soil #classification #System :

The Unified Soil Classification System (USCS) is a standardized method for categorizing soils based on their physical and engineering properties. It classifies soils into coarse-grained and fine-grained categories, further subdividing them based on grain size distribution, plasticity, and other characteristics. The USCS utilizes letters and symbols to represent soil properties, facilitating precise identification and characterization of soil types. Widely used in geotechnical engineering, the USCS aids in site investigation, foundation design, and construction planning by providing insights into soil behavior and properties.

The Link on the YouTube Channel:

Soil Mechcnics: Stress Distribution/Strip Loading/ Boussinesq Method

Excel Spreadsheet: #soilmechanics #stress #strip #Boussinesq :

In soil mechanics, the Boussinesq method is a classical analytical technique used to determine stress distribution beneath surface loads on soil. Named after Joseph Boussinesq, it assumes soil behaves as isotropic, homogeneous, and linearly elastic. By representing surface loads as point loads or continuous strip loads, engineers can calculate stresses at various depths below the surface, aiding in analyzing settlement, bearing capacity, and soil stability. While useful for preliminary analysis, the method has limitations in complex or non-linear soil behavior and loading conditions. Nonetheless, it remains valuable in foundation design and soil structure analysis.

The Link on the YouTube Channel: